Right On Page Devtools
A browser extension to help you debug web faster
on desktop, iOS and iPadOS
Browsers we support
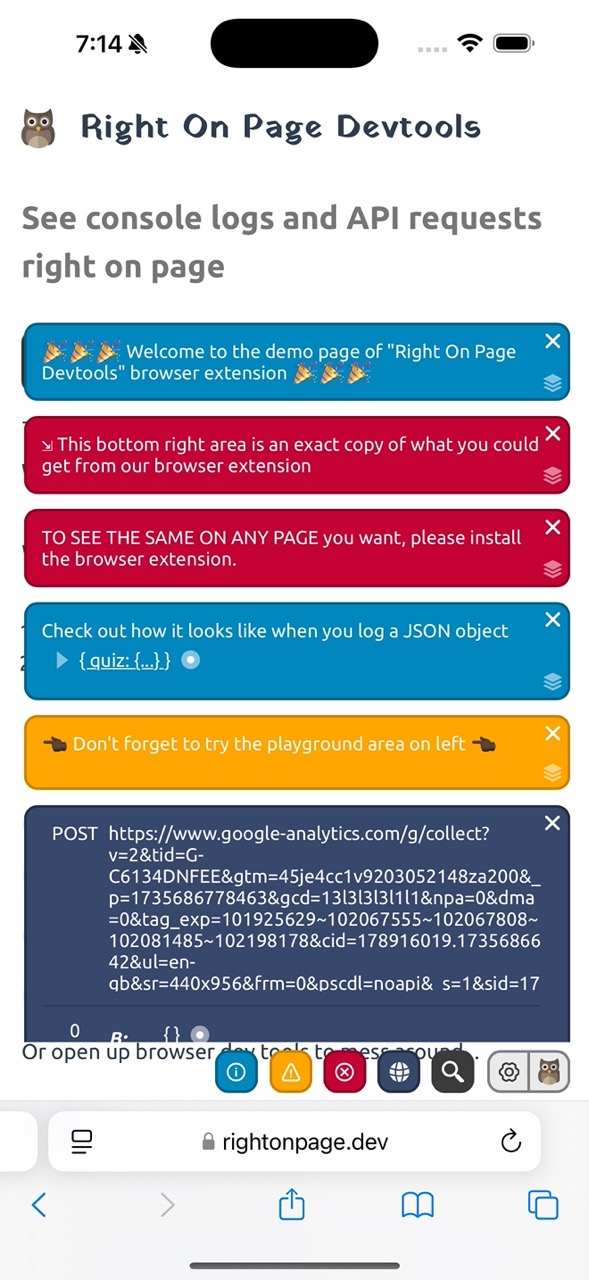
1. Bring API requests & console logs onto your page
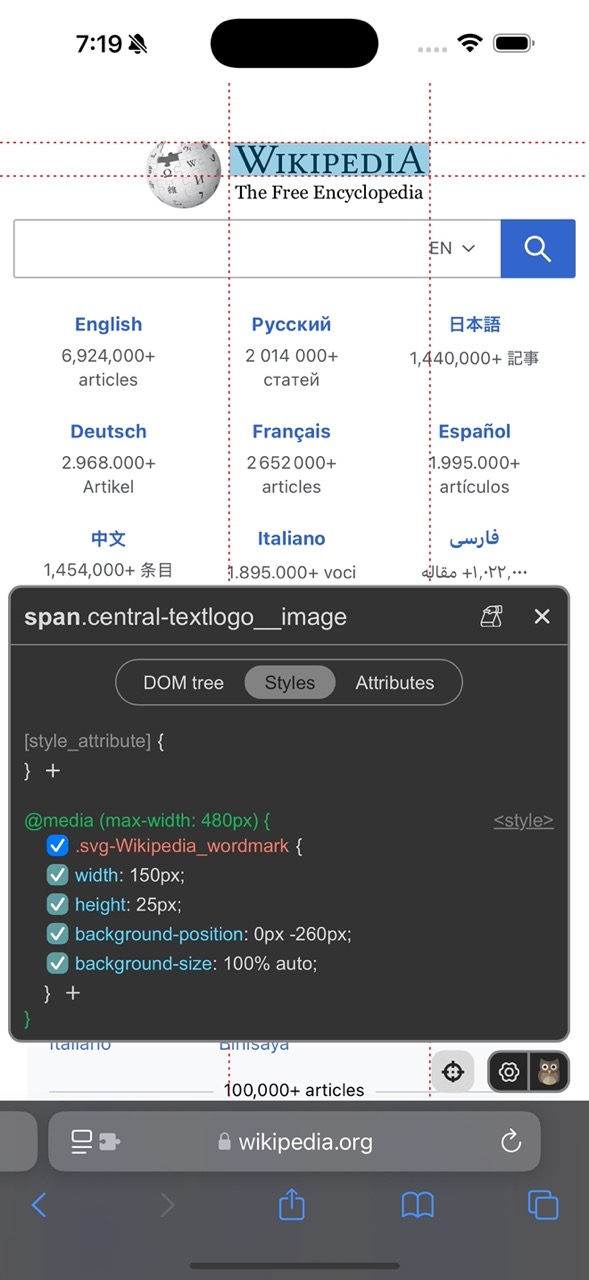
2. Inspect element on iOS & iPadOS Safari
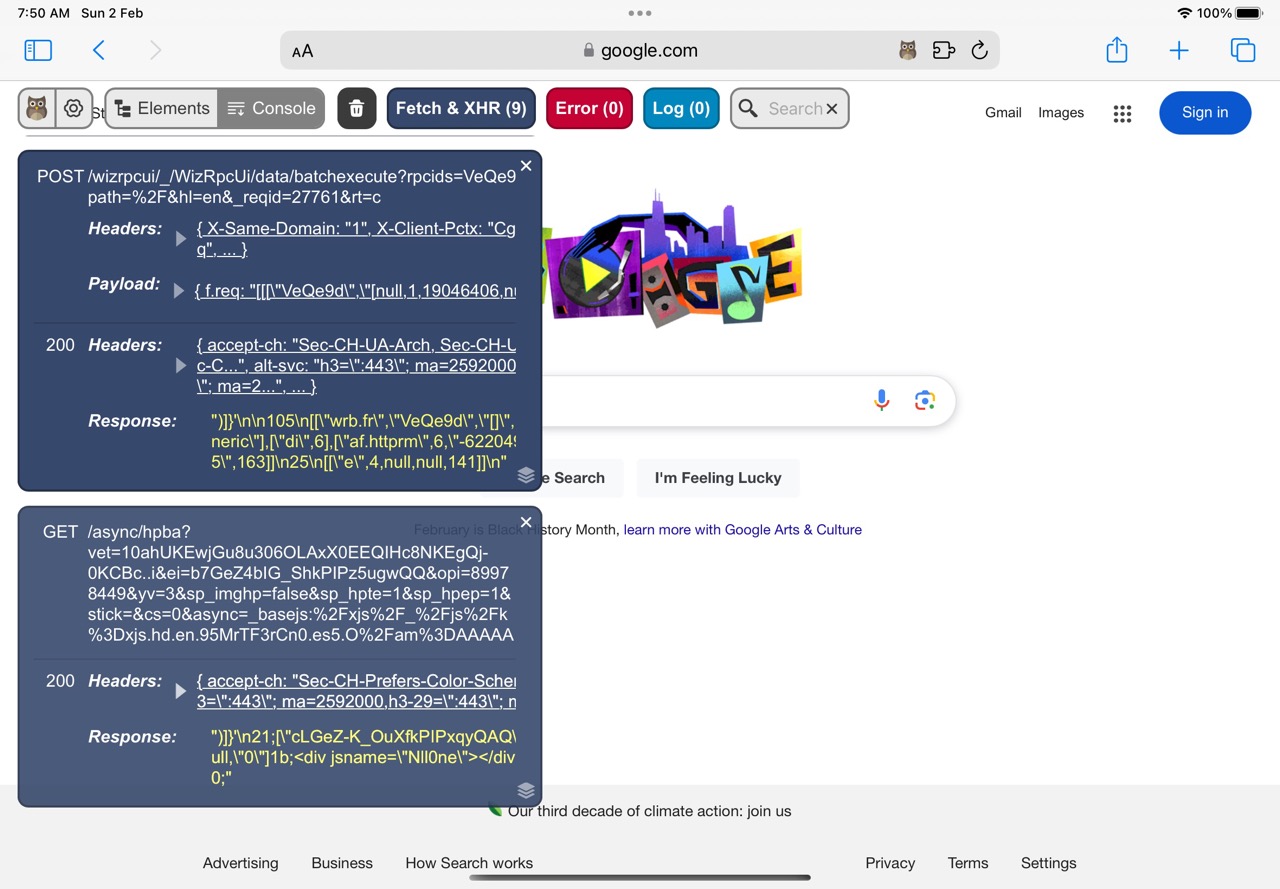
3. View console logs and Fetch/XHR requests on iOS & iPadOS Safari
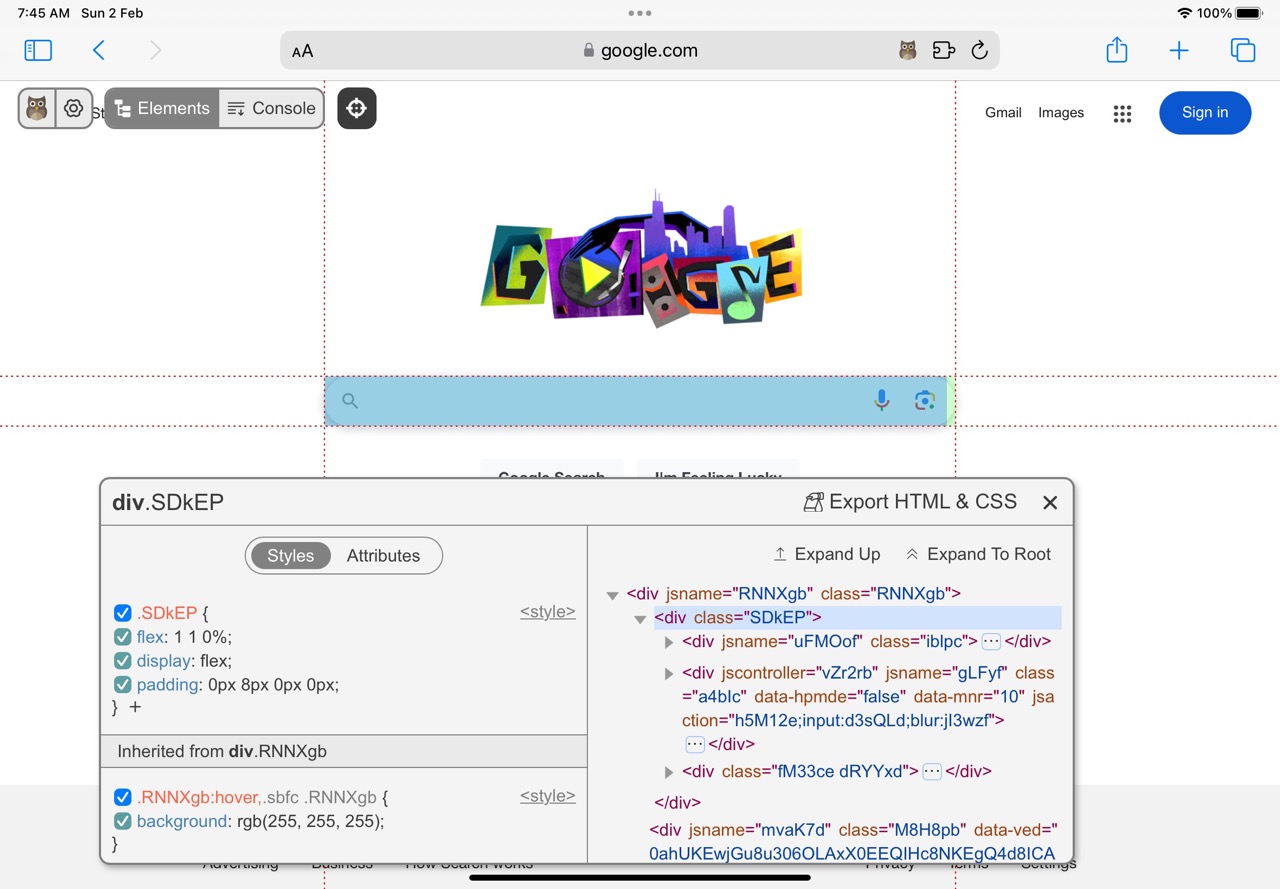
4. Snip HTML + CSS for any element you run into
Quick intro: 1.5 minutes.
We care about your privacy
- 🔒 No tracking, no data collection in our browser extension, read our privacy policy
- 🔒 Our browser extension requests permissions on a per-site basis, avoiding the need for any global authorizations
- 💳 We DON'T collect your credit card info. We use Gumroad for checkout and payment, please refer to their privacy policy
Why use it?

Merged logs and API requests
Instead of pressing F12, switching tabs between Console, Network, Headers, Payload, Response

Copy JSON with ease
Copy any part of a nested JSON with just one click

Get alerts on errors
You won't miss any exceptions on page any more

Search in all
Type once, and search in logs, request urls, headers, payloads, responses

Exclude noise
Easily filter out noise like requests for GA, appinsights

Movable to 4 corners
By either dragging the "owl" icon or modifying the position settings
'%3e%3cpath%20d='M170.666667,36.418278%20L170.666667,79.0849447%20L42.6666667,79.0849447%20L42.6666667,356.418278%20L341.333333,356.418278%20L341.333333,228.418278%20L384,228.418278%20L384,399.084945%20L0,399.084945%20L0,36.418278%20L170.666667,36.418278%20Z%20M313.751611,0%20L414.169889,100.418278%20L313.751611,200.836556%20L283.581722,170.666667%20L332.485,121.751%20L277.333333,121.751611%20C243.249474,121.751611%20215.388568,148.395237%20213.441977,181.991125%20L213.333333,185.751611%20L213.333333,292.418278%20L170.666667,292.418278%20L170.666667,185.751611%20C170.666667,128.391511%20215.942543,81.6061582%20272.706355,79.1834943%20L277.333333,79.0849447%20L332.484,79.084%20L283.581722,30.1698893%20L313.751611,0%20Z'%3e%3c/path%3e%3c/g%3e%3c/g%3e%3c/svg%3e)
Inspect & export element
Take away HTML + CSS for any element you like

Works on iPhone Safari
Inspect element CSS right in iOS Safari without tethering to a Mac
FAQ
💰 What kind of pricing?
One time payment for a lifetime license. Early birds get it for a lower price.
Check out this product page for more details.
Each license could support up to 5 devices.
Once purchased, your license could enjoy all new features of this tool for free.
🏗️ How does it work?
To capture console logs and errors and observe API requests, the browser extension wraps around API like console, fetch, XMLHttpRequest to monitor their calls.
To capture Javascript errors, the extension listens to "error" and "unhandledrejection" events.
🚫 Situations where it won't work
Right now we're not able to sniff API response with "content-security-policy" header that has restriction on "script-src"
🔇 How to turn it on / off?
Clicking on the "owl" extension icon will toggle its visibility for the current domain
The first click on each domain requires granting permission for us to access it.
All domains are turned off by default, except for rightonpage.dev .
⭕ What are counted as errors and exceptions?
1) console.error(..) 2) Uncaught JS exceptions 3) Unhandled Promise rejection 4) API responses with status code >= 400 .
❤️ What feature do you love most as the author?
Eating my own dog food, I really love checking and copying API request / response body & headers right on page.
Coming Features
- Preserve logs and requests in one tab
- Show all network requests right on page (not just API requests)
- Show changes to local storage right on page